Friday, December 9, 2022

Finding the B-21's hangar location from the stars in its press image

 https://twitter.com/johnmcelhone8/status/1600683623250030593

Saturday, October 8, 2022

QR codes Share

https://typefully.com/DanHollick/qr-codes-T7tLlNi

Second, the mask - what's that? Well, QR readers work best when there are the same amount of white and black areas. But the data might not play ball so a mask is used to even things out. When a mask is applied to the code anything that falls under the dark part of the mask is inverted. A white area becomes black and black area becomes white.

There are 8 standard patterns which are applied one by one. The pattern that achieves the best result is used and that info is stored so the reader can unapply the mask.

the 8 possible QR code masks


Thursday, September 15, 2022

Here’s Why Car Wheels Are So Flat These Days

 https://www.theautopian.com/heres-why-car-wheels-are-so-flat-these-days-and-no-its-not-just-aerodynamics-and-styling/

At first, rack and pinion gears were being applied to existing suspension designs but since the tire forces were being “amplified” by the large kingpin offset and scrub radius in those old designs, they were too much for the driver to take and were ripping the steering wheel out of their hands. Something had to be done and since there will always be potholes and braking forces, the only thing that the engineers could do to reduce the forces coming back through the steering system was to reduce the size of the kingpin offset and scrub radius. This meant the lower ball joints had to move outboard, the brakes had to move outboard and all the dominoes started to fall which spelled the end of deep dish wheels.

Saturday, August 27, 2022

Why No Roman Industrial Revolution?

https://acoup.blog/2022/08/26/collections-why-no-roman-industrial-revolution/

Eventually in the 1800s, these engines get small enough and fuel efficient enough to be able to move their own fuel over water or rails, collapsing the prohibitive transportation costs that defined pre-industrial economies and in the process breaking the tyranny of the wagon equation, decisively transforming warfare in ways that would not be fully appreciated until 1914.

But the technology could not jump straight to railroads and steam ships because the first steam engines were nowhere near that powerful or efficient: creating steam engines that could drive trains and ships (and thus could move themselves) requires decades of development where existing technology and economic needs created very valuable niches for the technology at each stage. It is particularly remarkable here how much of these conditions are unique to Britain: it has to be coal, coal has to have massive economic demand (to create the demand for pumping water out of coal mines) and then there needs to be massive demand for spinning (so you need a huge textile export industry fueled both by domestic wool production and the cotton spoils of empire) and a device to manage the conversion of rotational energy into spun thread. I’ve left this bit out for space, but you also need a major incentive for the design of pressure-cylinders (which, in the event, was the demand for better siege cannon) because of how that dovetails with developing better cylinders for steam engines.

Monday, July 18, 2022

Is it getting hotter?

I wanted to see what actual data said about how much hotter it has gotten in my area during my lifetime.  I know climate change is going on at a global level, but I just cared about my area, is it actually getting noticeably warmer, or is it just my imagination?

Before we go any further I should stress I'm not trying to prove or disprove climate change, or do any sort of serious climate science here.  I'm just trying to answer the question: Is it actually noticeably hotter here in the Philly area now than it was when I was a kid?

I've seen graphs of average temperature over time for cities before, but I feel like they tend to use average temperature over the year.  Which, I'm sure is a more important data point for climate science, but again, I only care about if I feel hotter here.  I don't really care about days that would have been 50F and now are 60F.  I decided the right metric to use for me is how many days over 90F per year do we see?  Is that number going up?

I won't turn this into a huge post.  I grabbed data from the NOAA here, in a CSV for the Philly airport from 1980 to 2021, which roughly matches the time I've been alive.  I threw that into a database and queried the count of days per year over 80F and over 90F, and graphed both, with trend lines.

graph of days over 80F in Philadelphia

graph of days over 90F in Philadelphia

Before I put the trendline on there, I have to admit I thought the 90F version didn't show any increase.  But then I noticed how few years had less than 20 days over 90F recently vs the 80s.  We haven't had a year with less than 10 days over 90F since 2014.

The over 80F version is a bit harder to read, but I feel like it shows the upward trend better, particularly if you focus on the 100 days line.  In the 80s there were a few years with more than 100 days over 80F. In the 90s it was about half the years.  In the 2000s it was most, and then in the 2010s it was all but 2, which barely snuck in under the line.

For fun I also looked for number of days where it never went above 30F.  Note this isn't just the daily low, this is the warmest it got on any given day, or in other words, days where it never got above freezing.  Spoiler alert, it's also getting less cold.

graph of days under 30F in Philadelphia

I did also pull the lows and looked at those,  they showed similar trends.  The 1980s had an average of 25 days below 20F, the 2010s had an average of 13 days, and 2021 had exactly 1.  The one graph I will post from the lows is this one of the number of days where the low is over 70F.  In other words, days where it never goes below 70F, even over night.  If you're looking to cool your house by opening the windows over night and closing them during the day when it heats up, it's going to be pretty tough to do if it's not going below 70F at all (which probably means it's still over 80F when you're going to bed).


graph of days with a low over 70F in Philadelphia

I was actually surprised at how clear the trend was in the data, and in every single version of the data I could think of to look at.  There wasn't a single dimension I looked at that didn't show this trend.  Turns out it is hotter now than when I was a kid.  Not a fan.

Tuesday, July 12, 2022

Mouse Heaven or Mouse Hell?

 https://www.sciencehistory.org/distillations/mouse-heaven-or-mouse-hell

Officially, the colony was called the Mortality-Inhibiting Environment for Mice. Unofficially, it was called mouse heaven.

Biologist John Calhoun built the colony at the National Institute of Mental Health in Maryland in 1968. It was a large pen—a 4½-foot cube—with everything a mouse could ever desire: plenty of food and water; a perfect climate; reams of paper to make cozy nests; and 256 separate apartments, accessible via mesh tubes bolted to the walls. Calhoun also screened the mice to eliminate disease. Free from predators and other worries, a mouse could theoretically live to an extraordinarily old age there, without a single worry.

But the thing is, this wasn’t Calhoun’s first rodent utopia. This was the 25th iteration. And by this point he knew how quickly mouse heaven could deteriorate into mouse hell.

Saturday, June 25, 2022

Converting numbers stored as decimal to binary encoded decimal values in PostgreSQL, or how I fixed my smart water meter reader

Intro

In my previous post about reading my smart water meter in Home Assistant, I left you on a cliff hanger.  You don't really need to go back and read that post if you haven't already.  Just know that I'm reading my smart water meter using a USB SDR dongle and a tool called rtlamr, (and a wrapper for that tool called rtlamr2mqtt).  While I seemed to be able to read the meter, and the ID matched the one printed on the label, there was a drift between the two readings.

Also know that you really don't need to read this post.  Of everything I've written for this blog, this may be the most absurd self indulgent post yet.  I can guarantee you, that no one will find the contents of this post useful.


Figuring out the offset

My initial readings from the SDR were 157815, while the physical meter read 268770.  I had a suspicion that the SDR would have to be multiplied by 10, because the physical meter had an odometer style dial for all the digits down to the 10s digit.  The 1s digit was a permanent 0, and then there was a clock style dial, which I assumed was the 1s digit.

water meter, showing the dials

I just sort of assumed that the SDR version of this number would also have a resolution of the 10s digit, but I hoped it was better.  It was also possible it was much worse.  The water company bills me by the 1000s of gallon.  If I understood the meter, that would be the white dials.  It was entirely possible the SDR was only broadcasting that number.  I also wasn't sure what kind of time lag there would be between usage and the SDR reading changing.  I was getting readings pretty constantly, about once a minute, maybe more, but those readings didn't seem to change when I was actually using water.

After the first night I could see the SDR meter updating about once an hour.  Not ideal, if I was going to use this to help detect leaks, but still better than nothing.

I would wait until a time when we hadn't used much water, and then record the physical meter.  If the SDR didn't update for at least an hour before and after the time I read the physical meter, then I assumed that SDR reading corresponded to the physical reading I had.  My plan was to do that about once a day for a while and then try to find the offset.  I figured with just two pairs, I should be able to find the equation of the line through those points and that ought to be enough to convert between the two.  That is, as long as the SDR was increasing in a linear way.

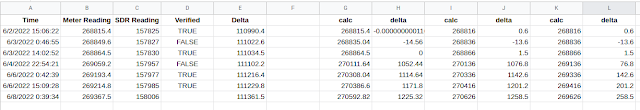
After a day I had these two readings.  With both I verified that the SDR reading hadn't changed for a while around the time they were taken, both around 3pm.

6/2: 268815.4    157825
6/3: 268864.5    157830

Solving that line gave me this formula to convert the SDR reading to the physical reading: physical = 9.82 * SDR - 1281026.1.  Looking at the multiplier of 9.82 I realized that confirmed my suspicion that the SDR reading was for 10 gallons, and that the factor should just be 10, the only reason it wasn't was the error in the SDR value, since that was only accurate to 10 gallons.  I simply used 10x and found the offset and that gave me the slightly updated formula of: physical = 10 * SDR - 1309434.

And with that, I was pretty much done...


Discrepancies

6/3 was a Friday, so I didn't get a chance to get a good reading over the weekend, but come Monday I took another reading to confirm my formula worked.  On the afternoon of 6/6 I read the physical meter at 269214.8, and the SDR reading was 157985.  Plugging the SDR value into my formula gave: 10 * 157985 - 1309434 = 270416.  Which is 1201.2 gallons too high.

Now this was damn peculiar.  I wouldn't have been surprised to see some error, but 1200 gallons was way too much.  The fact that it was close to 1000 made me suspicious that perhaps I had read something wrong.  Luckily I had taken pictures of each physical meter reading.  I double and triple checked everything, but got the same results.

I went back and looked at the graph of SDR readings.  There was a clear jump at about 11:30am that day.  The previous change was at 3am and the SDR value at that time was 157849, then at 11:30 that changed to 157952.  Note that just looking at the last two digits the value went from 49 to 52.  Those are 10s of gallons so 30 gallons used.  That seemed plausible, albeit still a bit high.  I began to wonder if the first 4 digits of the SDR number were actually something else, basically two independent numbers just concatenated together.  I tried subtracting 1000 from the readings after the jump, and that helped, but they were still off by a lot.

spreadsheet of SDR and actual meter readings

After a week of this I began to lose hope that I'd be able to correct this issue.  I tried fitting any curve to these numbers, even though it really didn't make any sense why the meter would go up in a non-linear fashion.  I started to rationalize that at least the SDR did seem to increase when we used water, and stay the same when we didn't.  At the very least, I could do something with that.


Stumbling Block

You may remember from my first post, that my first stumbling block was reading the default scm meter type, instead of the r900 type I actually had.  It turns out this was also my second stumbling block.

I began to be more sure that A. I was not making any mistakes with these readings, and B. this was a common enough water meter that someone else must have also had this issue.  After a lot of searching, and just reading through every issue on the github project that mentioned the R900 meter, I finally found this issue.

github issue suggesting to use r900bcd if r900 produces odd results

That was it.  Turns out there was another r900 type, called r900bcd (binary coded decimal).  I had seen this type, but figured if I was able to read my meter using the r900 type that meant that was what I had.  I never thought that the r900bcd type would also be able to read my meter, but produce different outputs.

Sure enough I changed the type to r900bcd, relaunched the program, and the readings matched the physical meter exactly (up to the 10s digit).  This was both a huge relief and super annoying that I wasted so much time on what was essentially the same problem I already had.

Either way, I was happy to have accurate water usage data, to within 10 gallons and approximately an hour.  I could definitely use that to detect leaks while we were away or asleep.  But now I had a new problem.  I had already collected a week's worth of priceless data.  What was I to do with these data points, which through no fault of their own, had been encoded incorrectly?

Well, if you'd like a snack now is the time to get one, because this is the part where the blog post gets good.  If you're somewhat annoyed at having read a 1000 word essay, which was essentially a preamble to the actual purpose of this post, please remember that you were warned earlier.


Binary Coded Decimal

"What is Binary Coded Decimal (BCD)" you almost certainly do not ask yourself?  Well it's a system where instead of just converting a full number into binary, you instead take each individual decimal digit and convert it into binary.  4 binary digits let you express all the numbers from 0 to 9, so you can represent each decimal digit with 4 binary digits.  Why would we do that?  It does have some advantages when expressing numbers which could grow quite large, and we don't want to lose any precision.  Dates and times are a good example.  We could (and often do) convert a time into just the number of seconds since X, and then store that as a big binary number, but using BCD lets us encode each digit in a date exactly.

graphic explaing BCD vs binary


Converting decimal numbers into BCD

Now I have these values which seem all over the place, but are actually just numbers which were converted from binary to decimal, when they should have been converted from BCD into decimal.  No information has been lost, I simply need to figure out how to correct the encodings of these numbers.  Though, it took me a while to even wrap my head around what set of operations I wanted to perform.

After thinking it through for a while, and doing some trial and error with online calculators, I figured it out.  I had to convert my decimal values back into (normal) binary.  I had to then break that binary number up into groups of 4 digits each.  And then, convert each of those groups of 4 binary digits back into a decimal number.  Finally, I could just concat those decimal digits into my correct value.

From about a week I didn't have that much data to correct.  I could have very easily written a little script to iterate over each value and convert it for me.  I didn't need to do this in SQL, and in fact I wasn't even sure I could do this in SQL.  But I was pretty sure SQL could convert decimal to binary and back again, and that (plus a bunch of string manipulation) was really all I needed.


The Query

So without further ado, here is the monstrosity of a SQL query I wrote to convert values which had been incorrectly converted from BCD to decimal as if they were simple binary numbers.


I'll attempt to walk you through it, but if you don't know SQL you might as well just skip ahead.  I start with a subquery, as I like to do.  This subquery is just trying to convert the numbers from decimal back to binary.  This is the part doing work:

select right((state::int / 10)::bit(32)::varchar, 20) as binary_num

First it has to divide by 10, then convert to binary, then cast as a string and just take the last 20 digits (4 bits * 5 decimal digits = 20 bits in BCD).  Now that I have that BCD string, all I have to do is split it up into groups of 4 bits.  Each
SUBSTRING(binary_num, 1, 4)::bit(4)::int::varchar

Is grabbing one group of 4 bits, converting it from a string to a binary number, then to a decimal digit, and then back to a string.  And then I just concat those together, convert that back to an int so that I can multiply that by 10, and that is my corrected value.

With that I had a bunch of lines of the ids that had to change and the values they had to change to.  Now, despite having written that query, I can never remember how to write an insert or update that uses a subquery off the top of my head.  Instead I just copied the results of the select into Sublime, and used my favorite text editor feature of all time, multi-line cursor.  I just wrote an update statement for each line all at once and ran those few hundred statements together in a transaction.


Result

And with that, all was right.  I had my priceless data, and could admire my graphs to my heart's content.  I'll leave you with this graph of the original vs the corrected data for your viewing pleasure.

a graph of actual water meter readings vs sdr readings


Reading my water meter from Home Assistant using a Software Defined Radio (SDR)

If you know me, you know that I must amass data.  To that end, I knew my water meter broadcast my water usage, and I had experimented with receiving that data in the past.  I also recently discovered this cool robot you can attach to any quarter turn water valve and remotely shut off your water.  I figured I could start reading and storing my water meter data, and use that to track usage, and also to attempt to detect leaks by looking for water usage while we were away or asleep.

 As is tradition, we have a long journey to get there.


Smart Meters

A smart meter is a meter in which the utility can read it without sending a person to walk up to it and read it with their eyes, or at least that's the definition I'm going to use here.  The newest smart meters are connected to the internet or form their own mesh network and the utility can get the readings on demand, whenever they want (called Advanced Metering Interface, or AMI).  There is also an older type of smart meter which simply broadcasts their readings every few minutes (called Automatic Meter Reading, or AMR).  The utility can then send someone around in a car to read all the meters while driving by.  They still need to send people out to all the neighborhoods, but they can cover way more ground than when they had to walk up to each meter to read it.

While the broadcast type of smart meter sounds worse, it's better for those of us who wish to hack into the signal and automate collecting data from their meters.  AMI meters are likely to be encrypted and the only way you can really access the data is if the utility provides a cloud based API to get it.  Many do, but I always prefer local solutions over cloud solutions.  AMR meters are (generally) unencrypted, and all we need to read them is something that will receive and understand the radio signals.


Software Defined Radio (SDR)

Software Defined Radio (SDR) is just what it sounds like.  It's a radio in which you can write software to determine how it functions and reads radio signals.  You get a hardware dongle and antenna and then can use different software to receive basically any radio signal.  The RTL-SDR is a very common open source one.  Everything you need is included in a kit for about $40.


Software

There is a ton of already written software out there for just about any purpose you could want to use a SDR for.  For reading smart meters the most common one is rtlamr.  The readme on that page is pretty good, but you run a separate utility called rtl_tcp in one console, then you run rtlamr in another console.  Then it'll begin dumping every smart meter packet it receives in your area.


Finding the right meter

If you can see your neighbors' houses then you'll be able to also read their meters when you fire up rtlamr.  Figuring out which meter was mine was my first stumbling block.  The ID of your meter should be printed either on the meter itself, or on a box that is wired to the meter.  I have three devices with serial numbers on them that are all connected together.  I copied down any serial numbers written on them and the current reading of my meter, and began looking through the data for a meter that matched either the serial numbers or reading.  There were at least a dozen meters I was reliably picking up, with a dozen more that I'd get occasional signals from.  I figured mine would be one of the strongest signals, and therefore one of the most frequent in the list.  The meters all seemed to broadcast every minute or so.

Still, none of the meters seemed to match mine.  This is what I was seeing (slightly anonymized):

rtlamr output showing meter readings

You can see it lists Type 5 and 12.  This file says that type 5 is electrical, and type 12 is either gas or electrical.  That was odd, because I didn't think I had a smart electric meter, and thought I probably had a smart gas meter, but was just about certain I had a smart water meter.

water meter broadcast device

This is one of the boxes that was attached to my water meter.  Googling it showed that a Neptune R900 was a very common water meter broadcaster.  I wondered if the ID it was broadcasting simply wasn't on the box, and if the reading it was broadcasting had some offset vs the one on my physical meter.  I had the candidate meters limited to a handful which I seemed to always receive the signals of, but none matched up.


Gameshark

Allow me to take you on a tangent.  This process reminded me a lot of my N64 Gameshark, which I often credit with getting me really interested in computers.  A Gameshark was a device a video game cartridge plugged into and then it, in turn, plugged into the console.  With the Gameshark between the game and the console it could access all the game's memory, reading and changing any values you wanted.  This let you cheat in games, but first you had to know what memory addresses to change, and how.  The memory addresses were always the same for a given game, but would be different for different games (or versions of the same game).  So if you wanted infinite lives in Mario 64, that was stored in some memory address, and once you knew which one it was, you (or anyone else who knew that address) could set that lives counter to whatever you want.  You could, of course, look these codes up online, but this was in an era of the internet when not literally every known piece of information was available within seconds.  It was often hard to find the codes you wanted, particularly for newer, or more obscure games, or if you wanted to do something else besides the common things like "infinite lives".

 N64 with Super Mario 64 and Gameshark

Earlier devices, like Game Genie, had a book with codes in it, but for new games you were out of luck.  The Gameshark provided a DIY way of getting these codes.  There was a button on the Gameshark, and when you pressed it, it froze the game and brought up a special menu.  This menu let you start a search for the right memory addresses that contained whatever it was you wanted to modify.  You then resumed the game and played for a bit.  Then you went back to that menu and told the Gameshark how the value you are searching for had changed.  You could say it went up, went down, stayed the same, or give it an exact value, or just that it changed in any way.  You repeated this process a few times, and eventually, from the millions of memory addresses only one would have changed in the exact pattern you specified.  Then you knew you had the right one, and you could change its value.

This process was super interesting to my 14 year old self.  The idea that literally everything about this game was just values stored in memory, and that I could modify any of them and that would modify the game I was playing was magic.


Finding the right meter, part 2

Anyway, with that section covered, I can now use this sentence: Like a real life Gameshark, I spent the night with my laptop next to my water meter and utility sink, using water to chage the water meter reading and waiting to see which broadcast meters matched my changes.  However, this only lead to more confusion as no meter seemed to match up with what I was doing.  This was complicated by not knowing what kind of lag there was between when water was used and when the new value would be broadcast, but I had pretty much ruled out any of the meters I could read being my water meter.

Upon researching this, I eventually stumbled upon some examples of other people reading R900 water meters with rtlamr.  They were all using the r900 type flag when launching rtlamr, rather than the default scm type I had been using.  For some reason I had assumed the default type would pick up all meters, and hadn't really paid attention to the other types.  Sure enough, changing the command to use the r900 type I got a totally different set of meters, with different types of data.  One of those meters had the exact ID printed on the yellow label on my Neptune R900 box, and so I was sure I had found the right meter.


Getting the data into Home Assistant

I knew I wanted to use MQTT as an intermediary to get the data into Home Assistant (HA).  When I first started dabbling with DIY sensors for HA I wrote a few custom components which would show up as a sensor directly in HA.  This proved to be a lot of work, particularly early on there were a lot of changes to the way these components had to work, and it was clear that making a custom component was intended for people who were planning on releasing their component for others to use.  I had no intentions of ever doing that, and having to support random people trying to use whatever hacked together, super specific to me, nonsense I had whipped up.

After a while, I just started writing data directly to the database.  Which I still do for a few things.  It works fine, although the one catch is I generally only put the data into the history table so it shows up in the history graphs.  I don't have the values available as a sensor that I can use to drive automations.  This is fine for most my purposes, because tracking the data is what I'm mostly after.

However, all of that is moot now, because I've discovered how easy MQTT is to use for this stuff.  MQTT is a protocol for sending messages on your local network, and is frequently used for DIY smart home devices and sensors.  You set up a server to run as a "broker" on your network, and then all your devices can publish to or subscribe to "topics".  So my DIY temperature sensors will publish to topics like: "home/bedroom/temperature" with a JSON payload there.  Home assistant then has a custom sensor you can use to read any topic and turn the values on it into a sensor.  If you get into MQTT I recommend MQTT Explorer as a GUI to help watch what data is being published to topics on your local MQTT network.

I almost began writing something to parse the text from this command line utility and send it to MQTT, but figured this would be the type of thing with a lot of glitches, and had the sense to search to see if someone else had already dealt with the headaches and edge cases.  Sure enough, I found a Python script called rtlamr2mqtt which did exactly what I wanted.  In fact, it even had an option to use the Home Assistant autodiscovery feature where, if you correctly format the MQTT topic, HA will just pick it up automatically.

The project uses Docker, but as I refuse to learn Docker, I just followed the steps in the Dockerfile manually and installed it as a regular ol' python script.

This was pretty much it.  There were some minor tweaks to the .yaml file that contained the configuration.  One cool thing I did was figure out I could multiple my readings by 10 by adding a 0 to the end of the format string, like this: "#######0".  This was nice because I was pretty sure my readings were for 10s of gallons.  The reading I was picking up didn't line up at all with what was on the physical meter, but I never really thought they would.  All that matters was if they moved by the same amount.

Over time though, I discovered the readings I was getting did not scale with what was on the physical meter at all.  They would for a short time, but then jump ahead, seemingly at random.  But, that odyssey will be in part 2.


Friday, April 8, 2022

What Protocol Lutron Caseta Uses

 https://www.smarthomepoint.com/lutron-caseta-protocol-clear-connect/

I'm a big fan of Lutron Caseta smart switches and this article does a good job of explaining how their protocol is more robust and faster than others.  I've noticed how fast it is to respond to commands sent from Home Assistant.

Lutron Caséta uses the Clear Connect RF communications protocol. This uses an entirely different frequency (434 MHz) from both Wi-Fi and 2.4 Gigahertz alternatives like ZigBee. The biggest reason for this change is to operate on a little-used frequency which gives users a better experience. Let’s take a closer look at why Lutron took the path less traveled.

Saturday, February 19, 2022

How to upgrade hard drives on a Linux file server

 Another in my series of blog posts about "The way I do things that fit my very specific and peculiar set of needs".  I recently upgraded my HDDs in my Linux file server, and found a pattern that worked quite well with minimum disruption.

How I have things set up

I have a headless Linux server with a SSD as the primary drive, and then a few spinning HDDs for bulk media storage.  All the drives are just formatted in ext4.  I do backups to S3 for important files.  Then, every time I upgrade the storage of these drives I copy everything to the new drive, and then remove the old drive from the machine.  That old drive serves as a backup for the bulk media stuff, combined with the plan to just redownload anything I got recently.

I've never bothered with RAID or more complex file systems because they only made sense to me if I had 4 or more drives, which I've never had.  This makes upgrading the drives a simple process.

My /etc/fstab file has a bunch of lines like this:
UUID=9fa3b7dc-3cd7-42c1-93a8-46dcf38da09d  /mnt/media         ext4  defaults  0  2

And then I share those drives using NFS by putting these lines in /etc/exports:

/mnt/media 192.168.1.0/24(rw,sync,no_subtree_check,no_root_squash)


Format the new drive

Put the drive in the machine and power it on.  If the drive is brand new it won't have any partition tables on it, or the UUID needed for the fstab file.  Here's a bunch of commands which are useful for figuring out which drive is which:

sudo blkid
lsblk -f
sudo fdisk -l

Once you know what the path to the drive is (eg, /dev/sdb), you can use fdisk to format the drive.  Be sure you have picked the right drive, because you'll wipe all your data on whatever disk you run fdisk on.  Use m to see the list of fdisk commands. But both F and p are useful to confirm you have the right (empty) disk.  Once you're sure you can run g to create the partition table, and then n to create the new partition.  The defaults should be fine.  Once you are sure you have things right, you can write your changes to the disk with w.

You now need to create the ext4 filesystem on your partition.  Do that with sudo mkfs.ext4 /dev/sdb1 making sure that your use the correct drive letter.  

Mount the new drive

Now run the above commands used to identify the drives again, and hopefully you see a UUID for the new drive.  Copy that UUID down and edit your fstab file with sudo nano /etc/fstab

and add the line for your new drive there, with a temporary mount point, like /mnt/media_new.  Then you need to make sure you create that mount point (sudo mkdir /mnt/media_new).  Then you can mount the drive with sudo mount -av . Now you can poke around and make sure things look right, you probably want to update the owner with sudo chown.

Copy the old data to the new drive

There are many ways you could copy the data, but I like rsync.  One nice thing is that if it gets interrupted it'll pick up where it left off.  Here's the command I came up with after exploring the options for a while: rsync -axHAWXS --info=progress2 /mnt/media/ /mnt/media_new/ The options largely came from here, so you can go there if you want to read what they do.  That took about 12 hours for me to copy about 5 TB.  While it will print out the progress, I found it much better to just ssh in on a new tab and then run df -Th and compare the disk usage of the old and new drives.  After the first pass though, running it again, to make sure there wasn't anything new, only took a couple minutes.

Make the swap

This isn't a foolproof process, you should close anything that is using the disks, and run the rsync command one more time.  Then you can unmount the current drive with sudo umount /dev/sda1.  Now you want to edit your fstab one more time and delete the old drive's line from it, while updating the mount point of the new drive to the one the old drive was using.  Now you can probably get way with just running sudo mount -av again, but I like to just shutdown (sudo shutdown -h now), and physically remove the old drive.

That's it

That's it. If all went according to plan, then everything that used the old drive previously, should now just use the new drive.  I had to restart my remote machines that used the NFS drives before they would connect.

Friday, February 11, 2022

Rome: Decline and Fall?

 https://acoup.blog/2022/02/11/collections-rome-decline-and-fall-part-iii-things/

But this now raises two related questions: first, why did population decline so sharply and second, what was the impact on quality of life that resulted? The old answer to the first question was of course ‘the barbarians killed everyone’ but as we’ve seen, while the fifth century was a violent time, the violent discontinuities were not that extreme. Surely the violence of the period has something to do with some of this declining population, but as noted, the underlying population (with their language and religion) didn’t much change (and the raw number of ‘barbarians’ coming over the frontier was, in demographic terms, fairly small). Most of those Roman cities decayed, rather than being burned. But if the ‘barbarians’ didn’t kill everyone, what did and why did that somehow have a negative impact on the survivors? The answers to these two questions are actually linked in that they depend on the same evidence, so that is where we will go next.
...

If you will permit me an extended metaphor, Rome wasn’t so much demolished by invaders as it was burned down by Roman arsonists who set fire to their own house – and they had been setting those fires since at least 235, long before Adrianople. The emperors of the fourth century (particularly Diocletian and Constantine) may have put out some of the fires by collapsing a wing of the house to smother them, but this can hardly be regarded as improvement, not the least because neither of them did anything to deal with the arsonists (one of which, Constantine, at least, must be reckoned). The emperors of the late fourth and fifth centuries then proceeded to invite people into the house, promising its shelter, if only they would help them light one more fire – and then when the house was burned down and everyone was left on the cold ground, they tried to shift the blame onto the very guests they had invited.

Wednesday, January 19, 2022

How GPS works

https://ciechanow.ski/gps/

This guy goes into so much detail, with great visualizations of everything he explains.  It's always a treat when he publishes a new post.