Update April 28 2011:
It turns out I was using estimate data from 2004-2009. I've since corrected the data, and all the links here will give the correct data. I made a post about this in more detail.
A common chart on the internet is one that shows the last couple decades worth of Presidents and the deficit or debt during their presidencies. The conclusion people are trying to make with these is that republicans are responsible for the largest increases in the debt.
Some examples:
http://www.lafn.org/gvdc/Natl_Debt_Chart.html
http://i136.photobucket.com/albums/q189/bouvetoya/buget.jpg
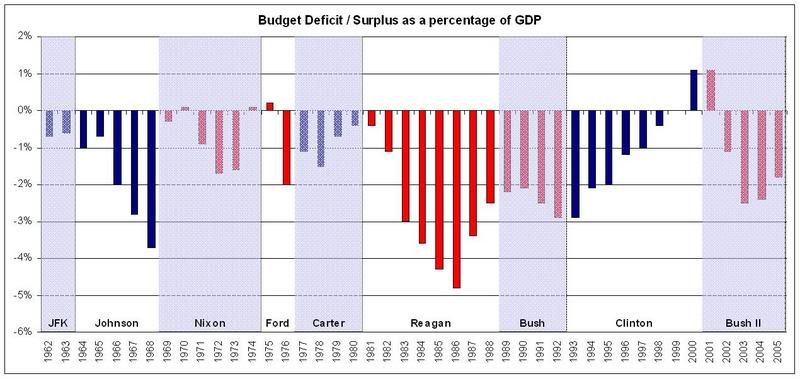
http://www.marktaw.com/culture_and_media/politics/USA_debt_2008/debt_percent_gdp_large.gif
http://zfacts.com/p/318.html
I have a number of problems with these charts (other than the standard statistic and chart issues). First there are simply too few data points to draw any meaningful conclusions. The counterargument republicans often make to defend the increases is that luck and economic cycles are responsible for most of the variance.
My biggest issue though is that these charts always give the blame and credit to the President for the budget. Like any other law, Congress is responsible for passing the budget. Once passed, it goes to the President and if vetoed needs a 2/3rds majority of Congress to override and become law. To review, no budget can become law without 50% approval of Congress, but it may become law without Presidential approval if it has 67% approval of Congress.
Skip past my rant about Congress ceding its power
There are some laws that deal with the procedure the budget follows, mainly The Budget and Accounting Act of 1921, which says that the President must submit a budget request early in the year. Some may think this gives the President more responsibility for the budget. However, like any law, it was created by Congress, and can by modified or repealed at anytime by Congress. Furthermore, Congress still ultimately writes the budget proposal based on the President's request. Thus the President's request is just that, a request. Which Congress can completely ignore. To use an analogy it would be as if you were tasked with writing some report at work, and you paid a Mexican day laborer to write it up for you. If you submitted that report you'd be responsible for whatever it contained. If your boss yelled at you a valid defense would not be, "Well I didn't even write that shit, man". Regardless of who you got to do the job it was still your responsibility.
People like to assign blame and praise to the President for things simply because he is an easy figure head to do so. However, if you actually read the Constitution, you'll see he doesn't have much power. In fact his powers are so limited I can list them here. He can veto bills that have 50% but not 67% approval of Congress. He is the commander in chief of the armed forces, however, Congress has ultimate authority over the finacing and very existence of the military. He can grant pardons and reprieves for federal, non-impeachment crimes. He can make treaties with 67% approval of the Senate. He fills appointments (like judges) with Senate approval. Lastly he's the head of the executive branch of the government. This means that his job is to execute the laws passed by Congress. In other words he ensures all those federal agencies actually do their jobs.
As you can see there really isn't much that he can do with out approval of Congress. And there isn't much he can do to stop Congress if they have 67% agreement on something. If you look at the powers each branch has Congress would seem to the be the one that has the best chance at becoming too powerful. This would be ok since the power would be split between hundreds of people, and the States would retain ultimate authority to change any part of the Constitution. In reality though, Congress seems to be the least powerful. Despite the fact that the other two branches largely exist to carry out the wishes of Congress, they have instead allowed repeated transgressions by the executive and judicial branches.
A large part of the problem is that when the President usurps a power he is not authorized to have there is little motivation for Congress to challenge him. This is particularly true if Congress knows it's not united enough to get 67% approval for impeachment. Another issue is that the power must be taken back by the party currently in control. Regardless of what party originally took the power neither party has a desire to give up the new illegal power. Thus, powers just keep building up, and no one wants to give them up. This is evidenced by the many unconstitutional things Bush did while in office. Now that a new party is in total control of the government (President plus 67% of Congress), they have the ability to easily strip all those powers from the President that he should not have. Yet they show no signs of doing so.
Ok, rant over.
Regardless of all that, Congress still passes the budget. They are responsible for its content. So for a long time I've wanted to look into which party controlled Congress and how deficit spending correlated to that. I resisted doing it for a while because I really hate the idea of political parties in general. I hate the idea that Congress would do something just because the bulk of its members belonged to some group that wanted it done. The fact remains though, that two political parties practically control the government. And that they both like to spend more than we have.
The (updated) data is here:
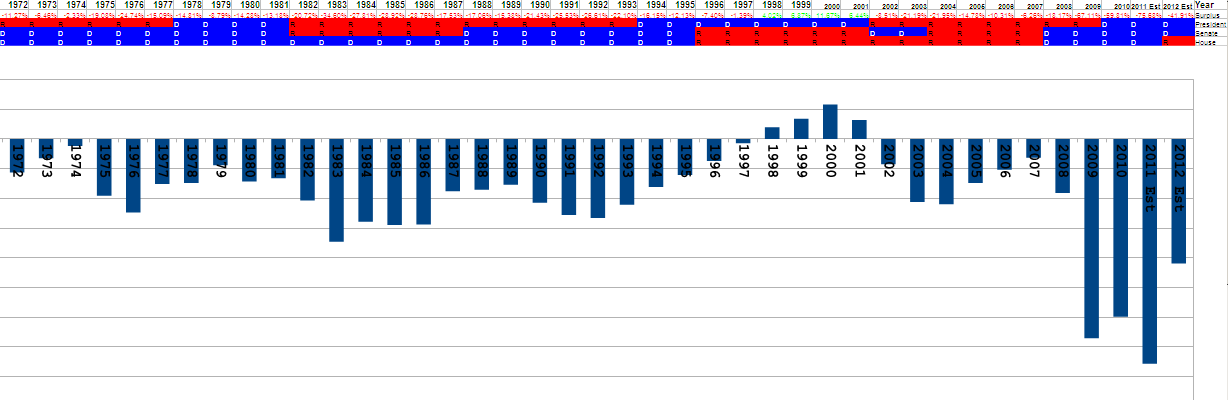
http://daleswanon.org/blog/deficits.png
http://daleswanon.org/blog/deficits2.png
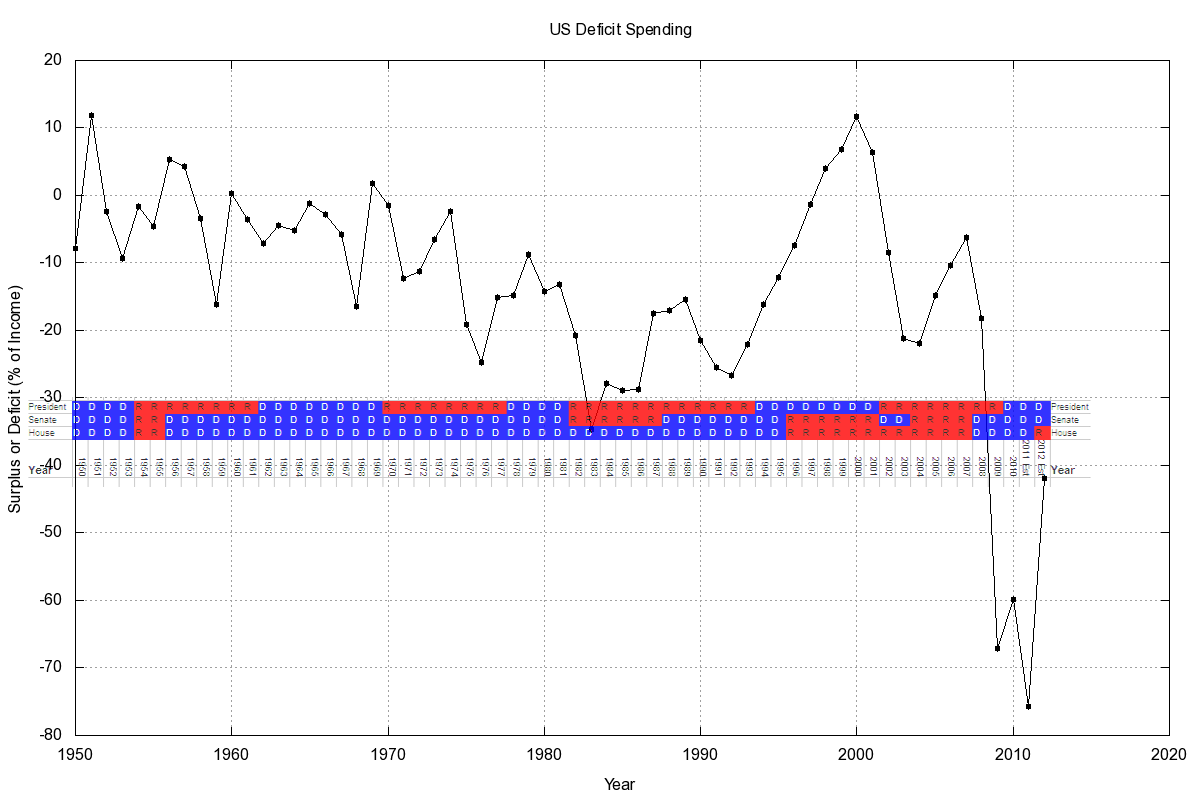
http://daleswanon.org/blog/deficits.pdf
http://daleswanon.org/blog/deficits.ods
Before I get started some notes about the data. First the budget is made a year ahead of time. For example right now in late 2009 Obama is working on his first budget request, for FY2010. As such I've used whatever political party controlled a particular office when the budget was approved for the year. I'm well aware that Bill Clinton, a democrat, assumed office in 1993. Yet 1993 has a republican R in the President cell because the budget for FY1993 was requested by George Bush in 1992. Second I calculated the deficit simply as the percent difference between revenue and spending. In other words how much more money the government spent than it took in. I went with this instead of something related to GDP, because it seemed more relevant. Regardless of how well the economy did or didn't do the government needs to spend an amount close to what it takes in. Lastly I seem to have lost the link where I found the budget data. It was from a .gov website, that let me download a csv file for 1900-2009. I've found the data again, but can't seem to find that nice csv file. Anyway the data can be found at:
http://www.gpoaccess.gov/usbudget/index.html
http://www.treasurydirect.gov/govt/reports/pd/histdebt/histdebt.htm
http://www.marktaw.com/culture_and_media/TheNationalDebtImages/TheNationalDebt.htm
Update: The spreadsheet is here:
http://www.gpoaccess.gov/usbudget/fy12/hist.html
I pulled budget data from 1902 to today, total revenue, and expenses. I then got data on which party controlled both houses of Congress and the executive. I combined this all and looked to see what patterns emerged. I honestly didn't know what to expect. I know republicans like to claim they spend less, but had little faith in that claim. Then there was the fact that there did seem to be some correlation between Presidential party and the deficit. The first thing that surprised me was how much time the democrats spent in control of Congress. They had control of the House nonstop from 1956-1996, and the Senate for the same except for 6 years from 1982-1987.
I would guess this is due to two causes. First as I have said people tend to blame the President for more than he should be blamed for, thus there tends to be more turnover than Congress. Almost everyone can name the President, most people probably can't name their representatives in Congress. Secondly term limits force turnover every 8 years. As for why democrats seemed to be favored in Congress but not the White House I don't know.
Since the democrats were in control so much, it limits the amount I can read into the data. However, the two major swings in the deficit do have a change in Congress control to go with them. First the major increase in the deficit in the early 80s. Second the decrease and brief elimination of the deficit in the late 90s.
A quick glance at the data might lead you to suspect the combined republican control of the Senate and executive starting in 1982 was to blame for the deficit growth, which started in that same year. Upon deeper inspection though this seems unlikely as the deficit shrinks back close to the 1981 level in 1987, with the republicans still in the Senate and White House. The next year democrats regain control of Congress and for the next 3 years the deficit hovers around the same level. Then, in 1990 it increases again, peaking in 1992. It then begins the well known climb out of the red and into the green, for the first time since 1969. This climb is often attributed to the democrats having control of the executive. There are some problems though. First looking at the chart the climb clearly begins in 1993, with the republicans still in control of the executive. Second the republicans gain control of both houses of Congress in 1996, and retain control for the entire climb up and then the fall way back down of the deficit, save for losing the Senate in 2002, and 2003.
So what conclusions can we draw from all this? Both parties were in control during both up and down swings, and the changes don't seem to line up well with changes of power. It almost seems as if having republicans or democrats in power makes no real difference to spending. And that is exactly the conclusion I draw from this.
What then is responsible for the swings? I'd place the blame largely on economic swings. If you look at the increases from year to year in government spending and revenue it averages to about 6.5% for the last 30 years, for both. 1977-1981 saw double digit increases in revenue, and spending. Revenue increase in 1982 was just 3%, while 1983 was -3%, the spending still increased at near 10% though. Thus it's no surprise there was a sharp increase in deficient spending starting in 1982. 1984 and 1987 saw returns to double digits revenue increases, as well as a decline in spending to less than the 6.5% average, and the chart shows this. 1992-2001 saw 2% and 3% spending increases, with average to slightly above average revenue increases. I'm tempted to congratulate Congress during this period on curtailing its spending (4 years republican, 6 years democrat). However, a much more likely cause is the end of the cold war, and a likely decrease in defense spending. 2002 and 2003 saw negative revenue changes, likely the cause of the large spike in the deficit. Spending averaged 5.5%, which honestly surprised me with all the war spending.
In the end both major parties are big spenders. The 30 year average was a -14.5% deficit. The Federal Government spends about 17% more than it takes in every year. While I'll agree that the two major parties differ on social issues, when it comes to government spending, neither knows how to keep a budget. The answer is to hold Congress responsible for our growing debt. They need to either increase taxes or decrease spending. Neither will be popular, and they aren't likely to do it unless they think they won't be reelected without doing it.
No comments:
Post a Comment